


Welcome to the Seasonality Go help page, here you can find all you need to know about the app and how to use it, as well as answers to questions you may have. To start navigating please select a topic on the left to learn more.
Seasonality Go is built with the idea that while you are on-the-go, you want weather software that adapts to your every need. To do this, Seasonality Go allows you to set up any number of screens, and each screen can be customized to best fit the weather data you would like to see.
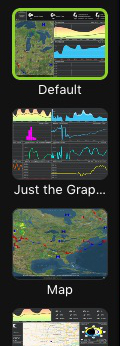
To get started, make sure your screen list is visible on the left side of the window. To toggle the screen list, tap the sidebar button in the upper-left corner of Seasonality Go. You will start off with a single screen by default, and you can add more as you see fit. Each screen will show a thumbnail previewing its content.
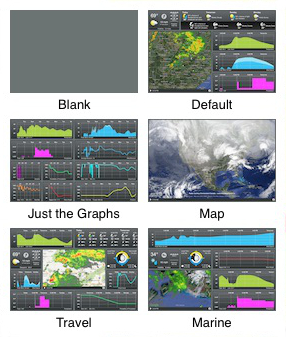
Let's add a new screen. To do this, tap on the + button at the bottom of the screen list. A grid of templates will appear. There are 5 templates to get you started with common screen layouts, or you can select the Blank template to create your own from scratch. Tap on one of the templates and a new screen will be added to your screen list, and it will automatically be selected and shown to you.
 Seasonality Go makes it easy for screens to be rearranged in the list. To do so, just tap and hold on a screen thumbnail, and drag it to the location where you want it to reside.
Each screen can show the weather for a different location. The location button will only change the location for the current screen. This allows you to pick a different location to show for each screen you add to your list. See the location help page for more details.
Customizing your screens is done through the Tools menu, accessible by tapping on the wrench button in the upper-right corner of Seasonality Go. The Tools menu gives you options to rename or delete the current screen, duplicate the current screen (giving you a chance to name the new screen that will be created), or to edit the layout of the current screen. The following is a more detailed description of the layout editing process.
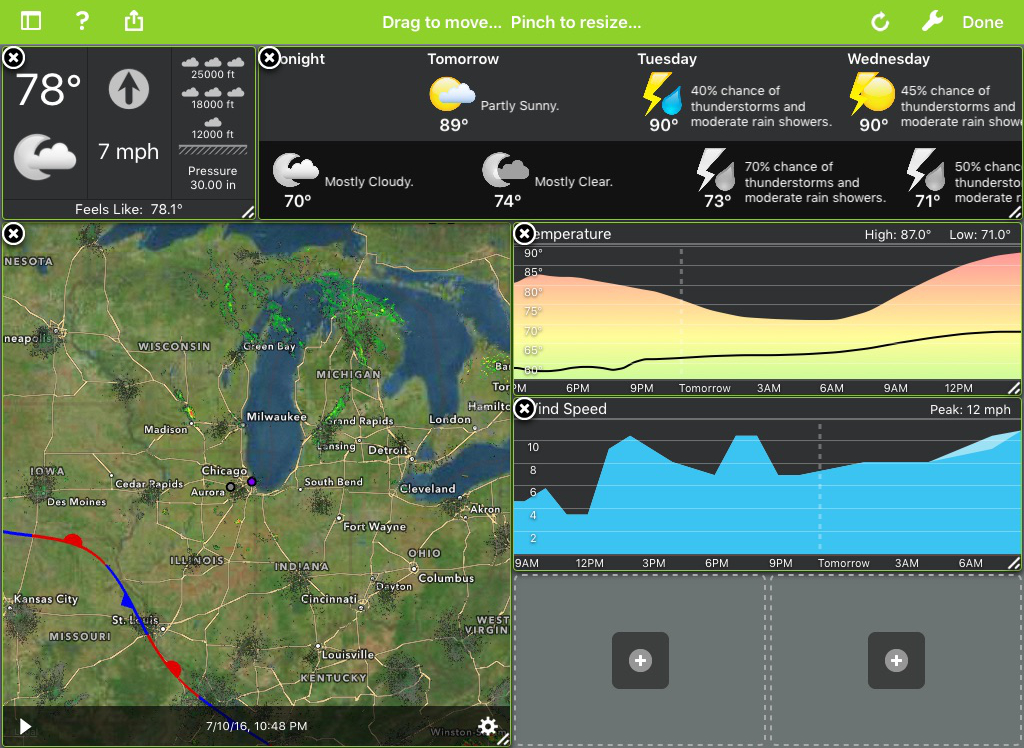
To edit the layout of the current screen, select Edit Layout from the Tools menu. When you are in Edit mode, each screen component, or insert, will have a green border and a close button associated with it. The Tools button at the top-right corner also changes to a blue Done button, and basic instructions are shown in the green location bar in place of the current location name.
Screens are laid out in a 4x4 grid, so you can have up to 16 inserts on a single screen. You can tap the close button for any of the inserts, and it will instantly disappear from the screen layout. In the empty grid spaces, you will see new + buttons to allow you to add new inserts to the screen.
To move a screen insert, just tap and drag it to a new grid space. If you drag a smaller insert over the top of a larger insert, Seasonality Go will swap the two inserts and their sizes (the smaller one will be in the space of the larger one, and the larger one will take the smaller one's original place). If you drag a larger insert over a collection of smaller inserts, Seasonality will try to swap the inserts. A red X will be displayed if swapping the inserts will not work in this situation (for example, if a swapped insert will collide with another insert that isn't involved in the swap). If this happens, resize or use a different method to accomplish your desired layout.
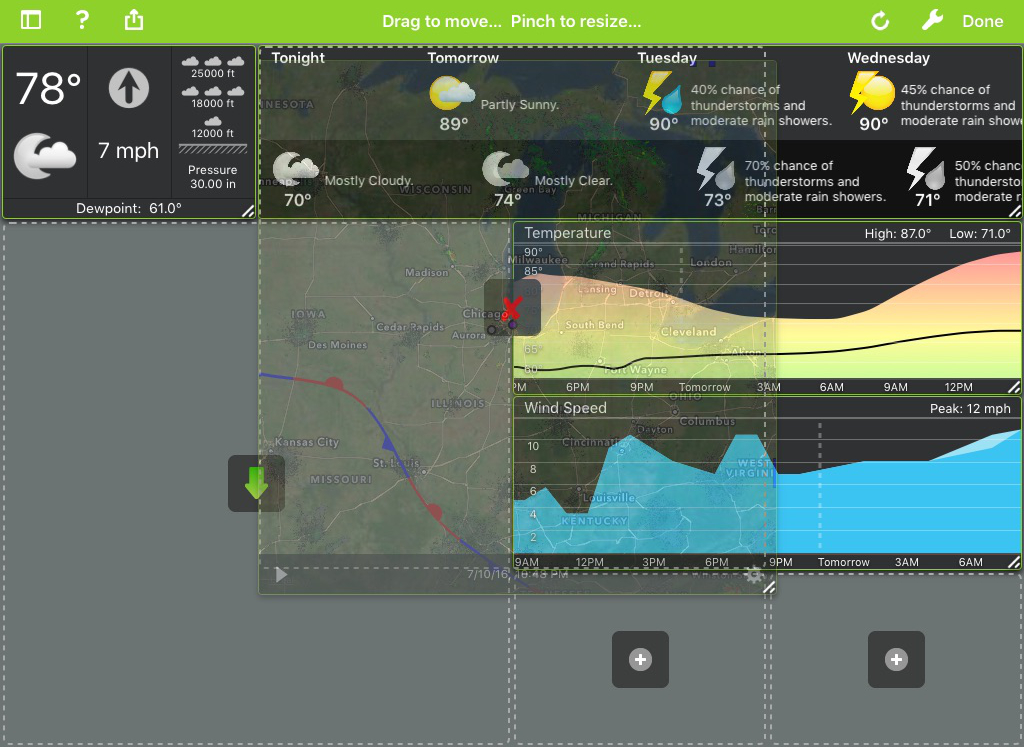
To resize a screen insert, simply pinch with two fingers anywhere in the insert and adjust it to your desired size. Seasonality Go will automatically constrain the sizing to the available area.
Once you are finished with your new screen layout, tap the blue Done button in the upper-right corner of Seasonality Go. Your layout will be saved for future use.
Seasonality Go includes a substantial list of more than 30,000 locations in over 200 countries around the globe. If your area isn't covered by a nearby location, Seasonality Go can optionally use the built-in GPS on 3G/4G iPads, or Wi-Fi location lookup on Wi-Fi iPads to add a custom location for your exact position. Locations are selected by tapping on the city title in the top center of the screen to view the Location menu. Locations are only changed for the current screen, so you can have different locations selected for each screen in your list.
The Location menu shows a list of your favorite locations. Tapping on a location will select it and close the location menu. Tapping on the "i" button next to each location will take you to a screen showing more information about that location. The first location in the list is the GPS location. Choosing this location will use Location Services on your iPad to create a current weather location for your exact position. If you are traveling and have Seasonality Go open for a long period of time, it will update your position and download new weather data whenever you move at least 5 kilometers.
You can search for a new location by tapping on the Add Location menu item. This will bring up a search dialog. Type in part of a city name, state name, country name, ICAO station name, or zip code and tap the Search button the keyboard. If you are having trouble finding locations, be sure you are only searching for one item of the options above. For example, instead of searching for "Los Angeles, California, United States", just search for "Los Angeles", or you can search for "California" to show every location in the state of California.
After searching for a location, select an item in the list to confirm this is the location you would like to choose. On the right, you will see a map showing the location of your selected city. If the pin on the map needs to be moved, you can tap and hold on the pin, and drag it to the correct position. Once the pin on the map is correct, tap the Done button.
Wave Height Data
The Wave Height graph is available along larger bodies of water on U.S. coastlines. The catch is that your location must be over the water in order for the Wave Height graph to work. To do this, search for a coastal location as usual above and tap a city in the list. Tap and hold on the pin on the map to move the pin out over the water, then tap Done. Once the pin is over the water, your Wave Height graph should load properly.
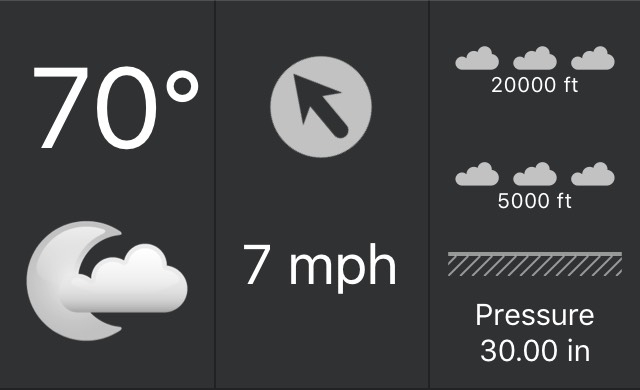 The current conditions insert shows you exactly what the weather is like in the location you are viewing. Current conditions will update at varying frequencies depending on the weather station selected, but most weather stations update every hour. There are 4 parts to the current conditions insert.
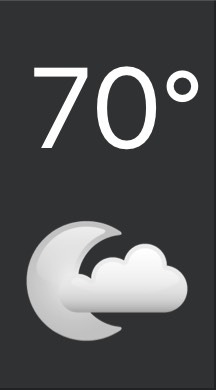 The first part of the current conditions insert shows the current temperature and an icon approximating the sky conditions.
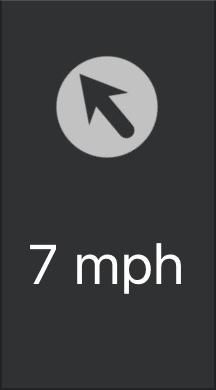 The next part of the insert shows the wind direction and speed. Typically you will see an arrow marking the wind direction, but if conditions are calm the arrow will be replaced with a small dot. Below the wind direction arrow is the wind speed. In cases where a wind gust is reported, you will see a range of values (8-12 for example) instead of just a single number.
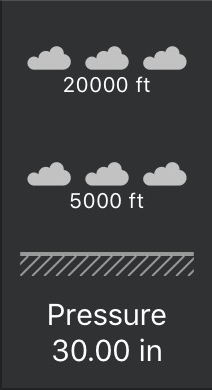 In the third part of the current conditions insert you will find a vertical cloud profile of the sky as well as a pressure report. The vertical cloud profile will show up to 3 layers of clouds and include their heights and cloud coverage. For each cloud layer, you will see a cloud image with either 1, 2, 3, or 4 clouds in it. The number of clouds tell you what percentage of the sky is covered by the clouds at that level, with 1 cloud denoting 25% of the sky all the way up to 4 for 100% of the sky. Below the cloud image, you will see a height marking telling you how high that cloud deck is above the ground. At the bottom of the vertical cloud profile, Seasonality Go marks the ground as a horizontal line with some diagonal lines beneath it. Finally, below the vertical cloud profile, the current pressure reading will be listed.
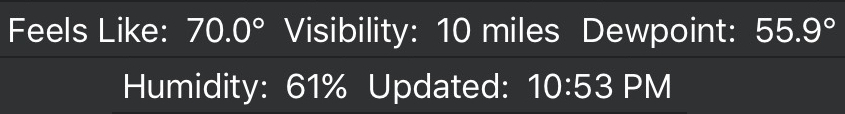
The fourth and final part of the current conditions insert shows a few miscellaneous observations. The feels like temperature will either show the heat index on hot days or the wind chill on cold days. The visibility is only available at airport weather stations and marks the distance you can "see" while looking toward the horizon. The dew point temperature and humidity are measures of the moisture content in the air. Finally, the last updated time shows the time this observation was taken.
Seasonality Go has a very customizable forecast insert that can fit just about any desired layout. The insert will adapt to the size and orientation you set, and displays differently in a 1x1 small block, standard horizontal orientation, as well as a vertical orientation.
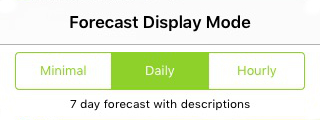
You can also configure the amount of detail you would like the insert to display. To do this, just double-tap on the forecast insert to show the settings. There are three display modes: minimal, daily, and hourly.
In the minimal forecast mode, Seasonality Go will just display the temperature and sky conditions icon for each time period.
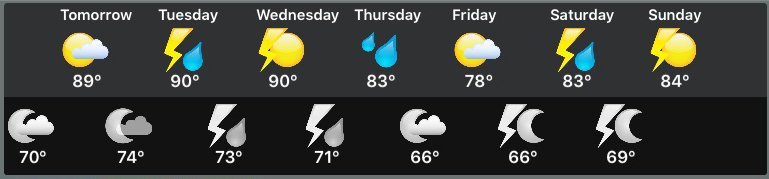
Using the daily forecast mode will give an average amount of detail with the temperature, sky conditions icon, and a 1-2 sentence description of the weather you can expect for that day.
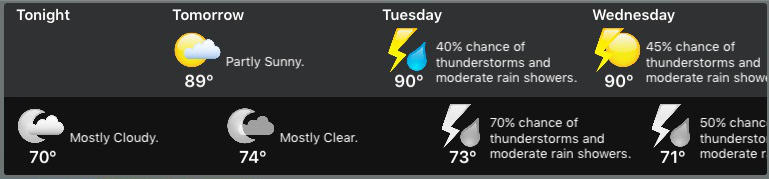
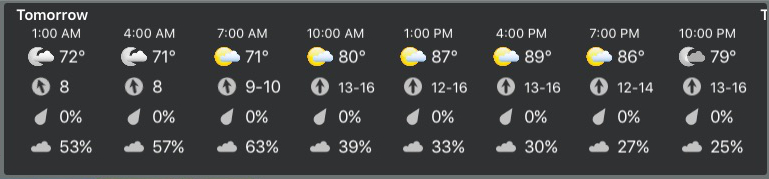
Finally, if you want a full hourly breakdown of the forecast, switch to the hourly display mode. Here you will see the time period labeled (every 3 hours) with a sky conditions icon, temperature, wind direction and speed/gust, probability of precipitation and the percentage of cloud cover.
To quickly switch between these forecast modes, just pinch on the forecast insert.
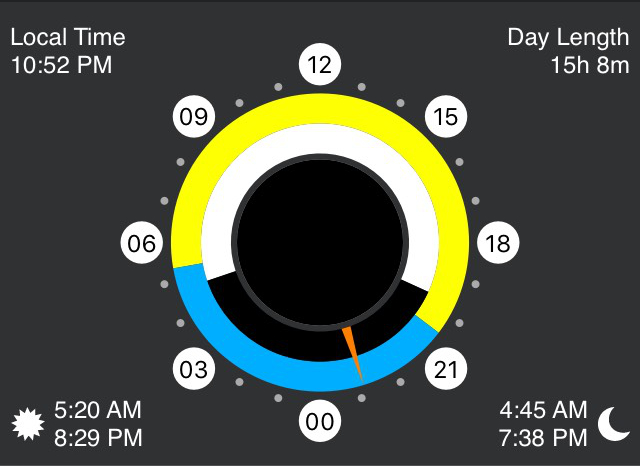
The astronomical view shows a graphical representation with rings of the sun and moon in the center, and specific times around the edges.
The rings show a graphical view of the times where the sun and moon are visible. The times of day are labeled around the outside: 00, 06, 12, and 18. So midnight is at the bottom of the ring, 6am on the left, noon at the top, and 6pm on the right. The outer ring shows the sun times: yellow for when the sun is up, and blue for when the sun is down. The inner ring shows the moon times: white for when the moon is up and black for when the moon is down. There is an orange marker on the rings, showing the time "now". The marker gives you a visual idea of how much of the day or night has passed.
In the center of the graphical representation is the current moon phase.
Finally, surrounding the graphical sun and moon display, Seasonality Go displays the exact times of sunrise/sunset (lower left), moonrise/moonset (lower right), current local time for the selected location (upper left), and the hours/minutes of daylight for the selected location (upper right).
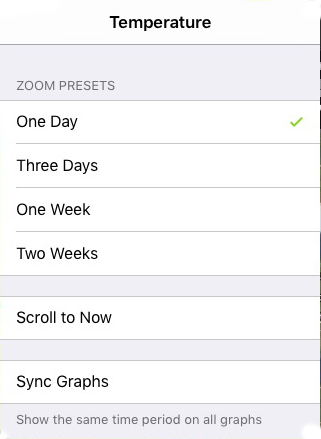 Seasonality Go can display a variety of weather graphs. Weather observations are collected whenever Seasonality Go is open and the latest 2 weeks are saved into a local database. Observations for most locations are available for the past 96 hours, so you only need to open the application once every 4 days to have a full collection of data. The time frame shown on the graph can be changed by pinching on the graph. There are also shortcuts in the graph settings to show one day, three days, one week, and two weeks of graph data. The graph settings can be accessed by double-tapping on a graph to show the settings popup. A vertical dashed line marks when "now" is on the graph.
By default, each graph scrolls separately, so you can have graphs showing different time periods on the same screen. If you would like to sync all the graphs, you can enable the Sync Graphs setting by double-tapping on a graph.
In addition to past weather observations, Seasonality Go graphs the next 7 day forecast as well. Using the graphs to look at the next 7 days will give you a better idea of what the weather is expected to be like during a particular time of day.
There are 10 different graph modes. I will talk about each of these in the sections below. If you tap and hold on any graph, a hover "bubble" will display with the exact measurement and time. This makes it very easy to dive into the data and look at specifics.
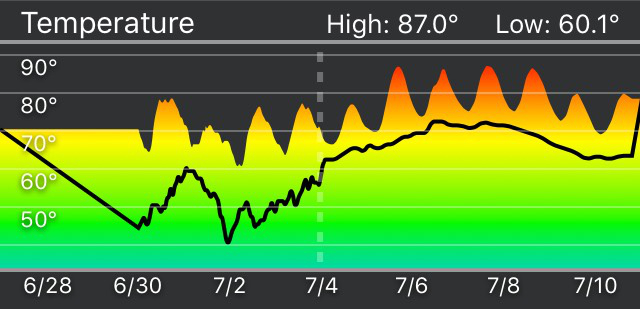
Temperature
Actual air temperature is shown on the display. High and low temperatures for the time frame shown on the graph are displayed on the temperature graph. The temperature graph also shows the dewpoint temperature as a black line. The dewpoint temperature is the temperature at which the air must be cooled to in order for dew to form. As the dewpoint temperature gets closer to the air temperature, humidity goes up. When the dewpoint is equal to the air temperature, humidity is 100%.
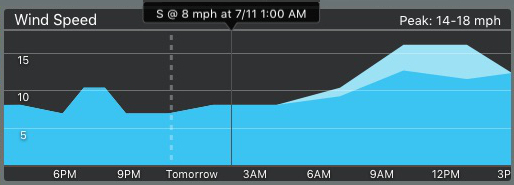
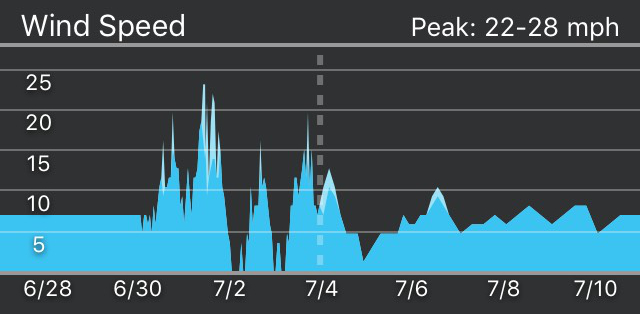
Wind Speed
The wind speed graph shows gust speed in a lighter blue to give a general feel for the range of wind speeds at the location during a particular time. Also displayed in the wind speed graph is the peak wind speed. If you choose a single wind graph to show, this is the one you want. It's the only graph that gives you the full wind speed and direction (using the hover).
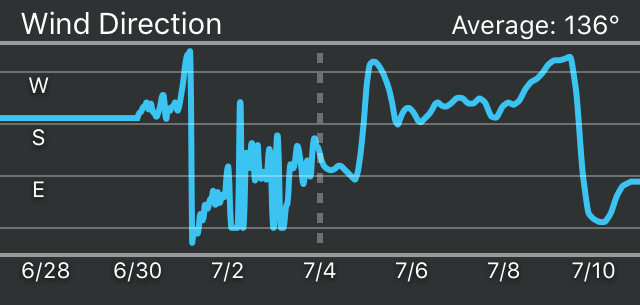
Wind Direction
The wind direction graph shows a basic view of which direction the wind is coming from. Both wind graphs will vertically center around the average wind direction for the time period shown on the graph. The average wind direction is shown in degrees at the bottom of the graph.
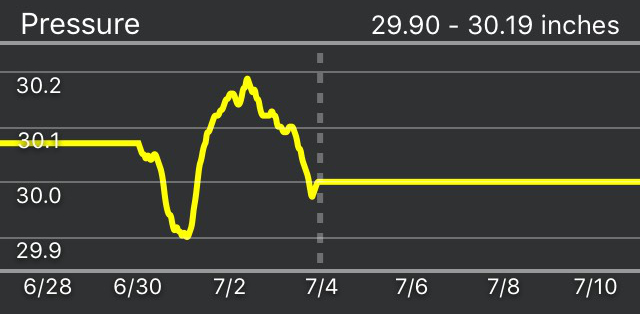
Pressure
The pressure graph shows the weather station pressure reduced to sea level. This graph will also note the ridge pressure (the greatest pressure value during that time period) and trough pressure (the lowest pressure value during that time period). The pressure graph is centered at 1013 hectopascals (29.92 in. Hg), which is the average surface pressure globally (when reduced to sea level). The pressure graph is only available for past observations. Pressure forecasts are not available at this time.
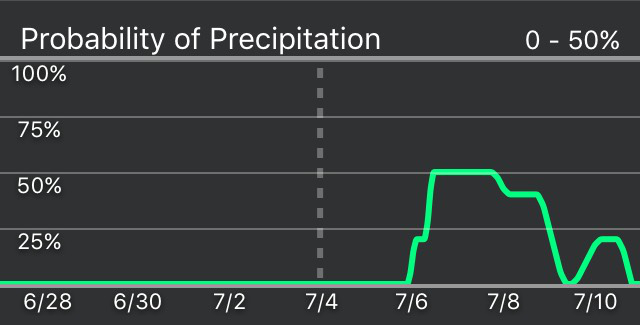
Probability of Precipitation
The probability of precipitation shows the percent chance that at least 0.01" (or 1 mm) of precipitation will fall at the given area during the marked time period. The forecast for locations outside the U.S. is slightly biased toward a higher probability of precipitation. This is due to the model being used to run the forecast simulation.
Precipitation and Snowfall
These graphs show a precipitation and snow forecast for every location. Some locations will also show past precipitation (not snow) observations, if the weather station supports it. These graphs are the only bar charts of the group. They show the amount of precipitation that is expected (or has fallen) during a certain amount of time. If you add all the bars up, then you will get the total precipitation for that time period (which is shown at the bottom). Some weather stations report observations more often than others, so the bars can vary in width depending on the location's weather station.
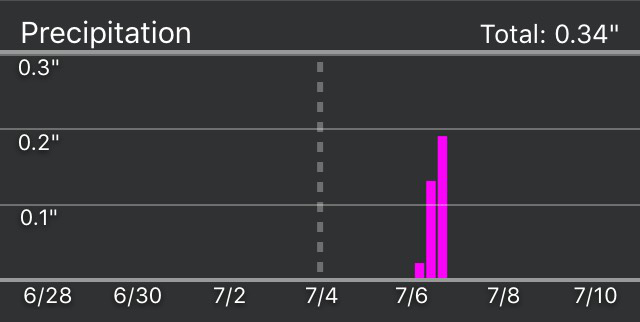
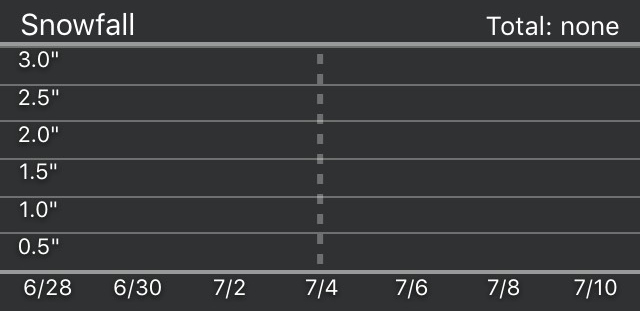
In the winter, if snow is expected you will see values on both the precipitation and the snow graph. The snow graph shows how much snow is expected to fall. The precipitation value in this case is how much water content would be in that snow (if the snow that fell was melted). You can get a better idea of how heavy the snow will be if you compare the two numbers. Average snow:liquid ratios range from 10-15 inches of snow for every inch of liquid equivalent. A heavy snow might have a snow:liquid ratio of 4:1, while a dry fluffy snow might have a ratio of 30:1 (expect a lot of snow in these situations, even though it will be less dense).
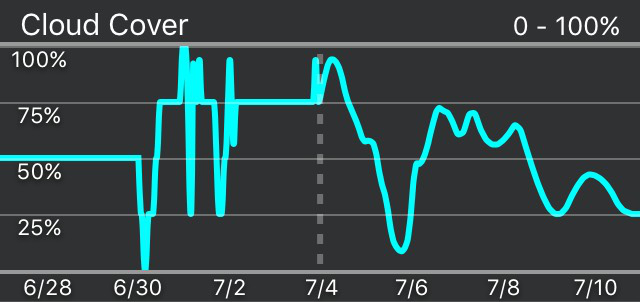
Cloud Cover
The cloud cover graph displays the amount of sky that is expected to be obscured by clouds at any given time. The cloud cover forecast is much more precise than past observations, but they both give you a pretty good idea of what the sky is like at the time.
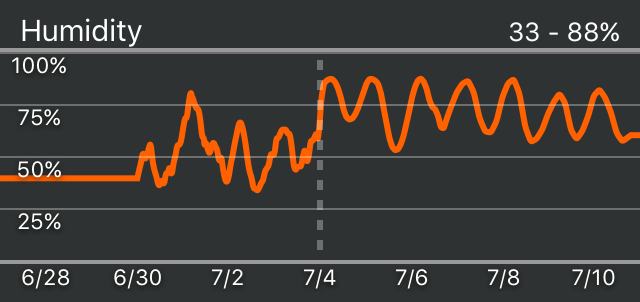
Humidity
The humidity graph shows relative humidity on a scale from 0-100%, along with a textual display of the maximum and minimum values on the graph. Relative humidity is not necessarily a good representation of the amount of moisture in the air. The value is defined as the amount of water vapor in the air divided by the maximum amount of water vapor the air can "hold." Since the maximum amount of water vapor air can hold changes with the air's temperature, the relative humidity doesn't really truly tell you how much moisture is in the air. This is why you will often see the relative humidity drop during the day as the temperature rises, and return to a higher level as the temperature cools down at night. Though relative humidity doesn't truly tell you how much moisture is in the air, it does give you a good idea of how comfortable the air will feel, which is why this graph is included in Seasonality Go.
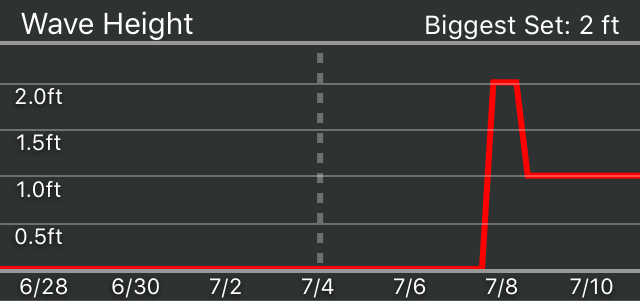
Wave Height
This graph is for coastal locations in the U.S. only. If you have a location that is over a large body of water (ocean or Great Lakes), this graph will show the forecast for significant wave height. You can think of these heights as how big the "set" waves will be, and not the average wave height. To get a location that is over the water, see the wave height section of the Location help page. Note that the forecasts for your water locations will change quite a bit from locations on-shore. Forecasted temperatures will be much closer to the water temperature, and forecasted wind speeds will be higher because there isn't much friction at the surface of the water.
Seasonality Go includes high performance mapping code to actively generate custom weather images for your iPad. Seasonality Go currently offers three overlays to show on top of the selected map terrain: base reflectivity radar, infrared satellite, Particle Mode, and Surface Analysis.
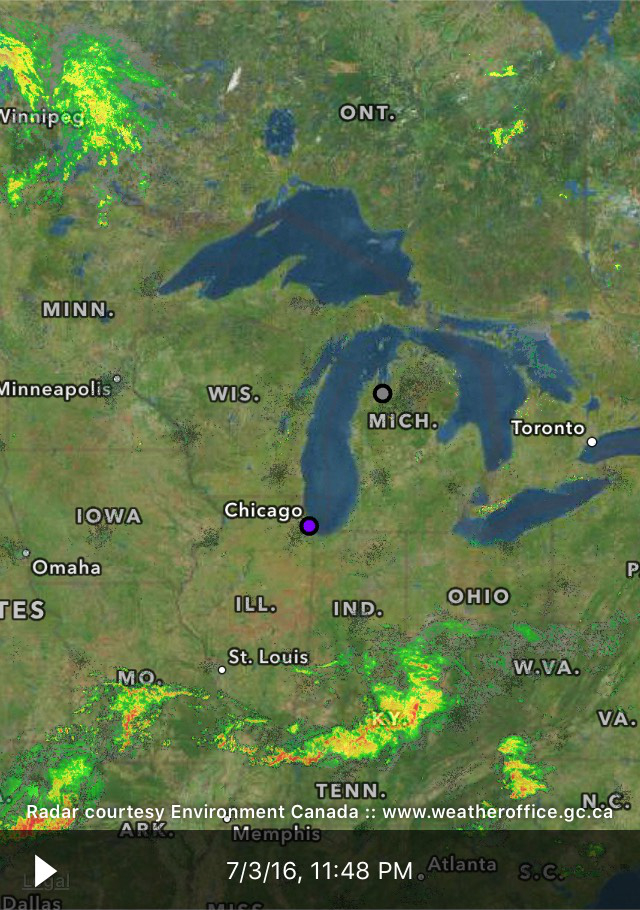 The radar is base reflectivity scan data from NEXRAD stations across the United States. Seasonality Go also composites radar from Environment Canada and the Bureau of Meteorology in Australia for coverage in those countries as well. It's impossible to offer radar coverage everywhere, but we continue to look for publicly available radar data offered by other countries. Radar images are updated every 12 minutes.
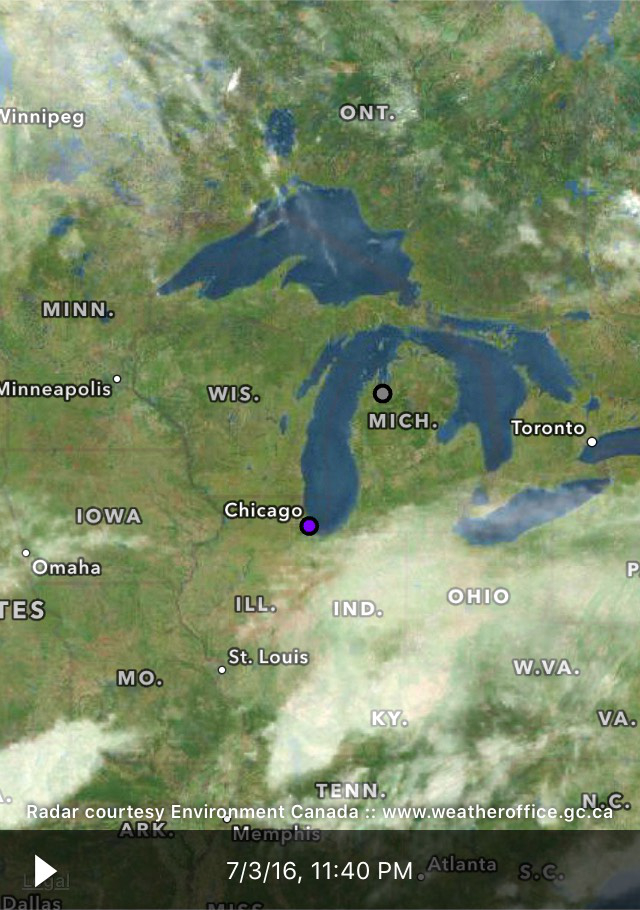 The satellite images are sourced from the University of Dundee and composited on a Gaucho Software server. Since infrared satellite images are used, you can see where the clouds reside, even at night. The disadvantage of using infrared images is that sometimes low altitude clouds (such as fog) doesn't show up as well in the image. Satellite images are updated every 3 hours.
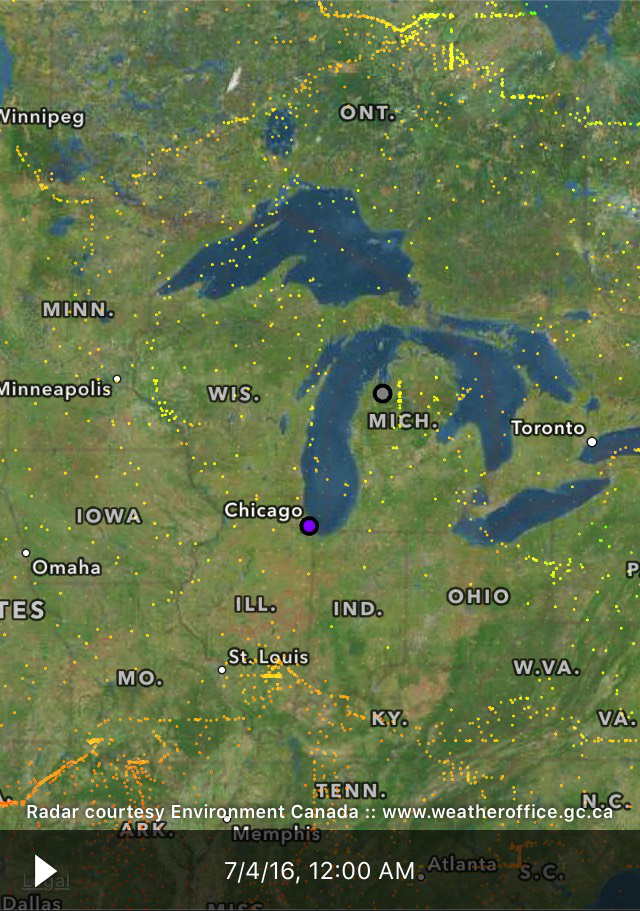 Particle Mode is an overlay you won't find in any other app. Particle Mode shows what it would look like if you dropped thousands of particles on the surface of the earth and the wind blew them around. This overlay is best viewed while zoomed a bit further out than usual. Seasonality Go downloads the latest model wind data, so what you are seeing matches what is really happening around the world right now. Particles are colored by temperature, so in a quick glance you can see how the temperature changes in different regions.
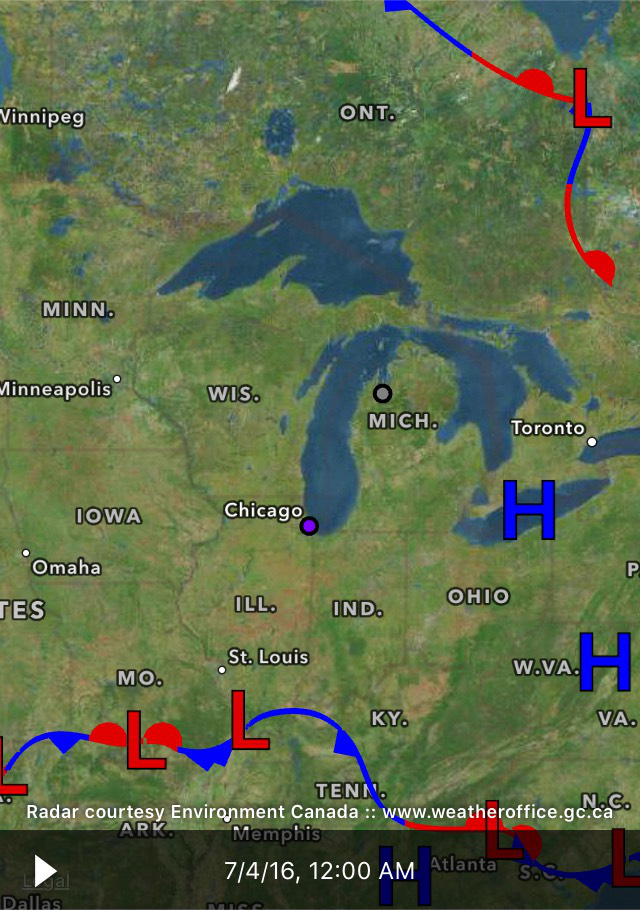 The surface analysis overlay covers most of North America and annotates weather features that are typically seen on TV weather reports. This includes features like cold fronts, warm fronts, occluded fronts, stationary fronts, low pressure centers, and high pressure centers. The surface analysis is updated every 3 hours.
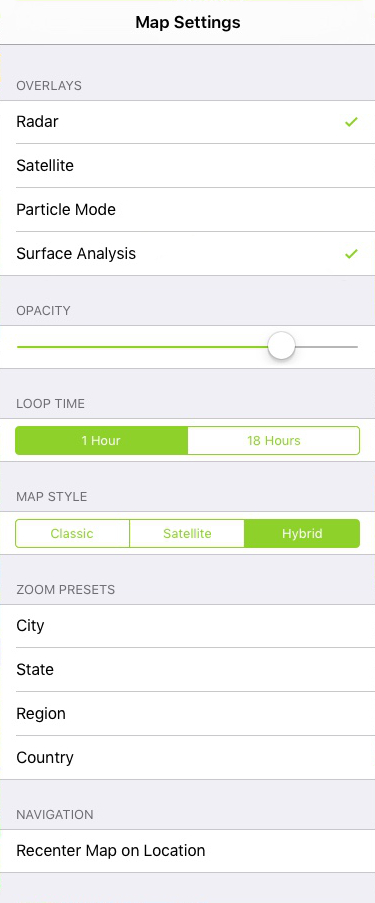
Settings can be adjusted by tapping on the gear button in the lower-right corner of the map. Looking at the settings from the top down, first you can configure which overlays you would like to display along with the opacity to use for the overlays.
Next you can configure the loop time. If you select 1 hour, the satellite image will hold constant while the radar animates (since satellite images change only every 3 hours). If you select 18 hours for the loop time, then both the radar and satellite images will animate through that time period.
Below the loop time, you can select which map terrain you would like to display. Hybrid typically looks the best with weather data, unless you are looking for more street-level details where the "Classic" terrain looks pretty sharp.
The final two settings offered both provide shortcuts for map navigation. You can tap the zoom presets to have the map zoom to an approximate level to show a city, state or province, region, and country. Below the zoom preset is the final setting to recenter the map on your location. This makes it easy to explore the map and conveniently return to where you started.
Seasonality Go provides powerful customization features to allow you to view weather data however you want. To create a new customized screen, first make sure the screen list is shown (tap the screen list sidebar button in the top left corner), then tap the add screen (+) button at the bottom of the list. You can either start with one of the 5 built-in templates, or create a blank screen to start from scratch. Once your new screen has been created, tap on the tools icon in the upper right corner, and select Edit Screen.
From here you will be able to add new inserts, close existing inserts, or move and resize inserts. Add inserts by tapping any of the + buttons over an empty screen area. To move an insert, just tap and drag it to a new spot. To resize an insert, tap with two fingers and pinch to adjust it to the desired size. Finally, to close an existing insert, just tap the (x) button in the upper left corner of the insert. When you are finished setting up your new customized screen, tap Done in the upper right corner.
How often does Seasonality Go refresh weather data?
Seasonality automatically refreshes weather data, so you should always be viewing the most recent data. Radar images update every 12 minutes, current conditions and past graph data is updated every 30 minutes, forecasts update every hour, and satellite images update every 2 hours.
How do I delete a screen?
You can delete a screen by tapping on the tools menu in the upper right corner and selecting Delete Screen.
Can I reorder screens?
Yes! Just tap and hold on the screen you would like to move, and then drag your finger to the new location.
Why do some graphs not show future/past data?
Some data is not available in the forecast or observed weather station data. For example, the forecast data does not include Pressure or Humidity variables, so Seasonality is only able to display those variables on past graphs. Likewise, snowfall and wave height are not measured at weather stations, so these datasets are only plotted on the forecast graphs. The graphs mark a dotted line at the current time, so you can see where the graph switches from past observations to the forecasted conditions.
Can I switch to metric units?
Yes, units can be set in the Tools menu under App Settings.
How can I change the color theme?
A variety of color themes are available by selecting App Settings under the Tools menu.
How can I view the wind direction?
The wind direction can be viewed by tap and holding on the Wind graph. A context bubble will display just above the graph, and you can slide your finger across the graph to view wind speeds and directions for any time shown on the graph. The current wind direction is also available as an arrow on the Current Conditions insert.
Developed by Mike Piatek-Jimenez. Interface designed by FJ de Kermadec, Chris Emery, and Jochen Wolters and others at Trumper, Forsyth and Kline.
Data used in Seasonality has been provided free of charge by many online sources. These sources are acknowledged below.
United States Forecast Data: The National Digital Forecast Database
Provided by the National Oceanic and Atmospheric Administration
Global Forecast Data: The NOAA Operational Model Archive Distribution System
Provided by the National Centers for Environmental Prediction
Global Satellite Cloud Map: Dundee Satellite Receiving Station
Provided by the University of Dundee
Current and Past Observations: The Aviation Digital Data Service
Provided by the Aviation Weather Center
Canadian Radar Images: Environment Canada
Australian Radar Images: Bureau of Meteorology