Seasonality Go puts an advanced weather tracking and analysis engine on your iPhone or iPad, and it is all touch-based to boot, for simplicity.
Our back-end collects and processes data from around the globe, from the basics, such as current conditions and forecasts, to advanced parameters such as wind velocity, cloud cover, pressure, snowfall, wave height and more.
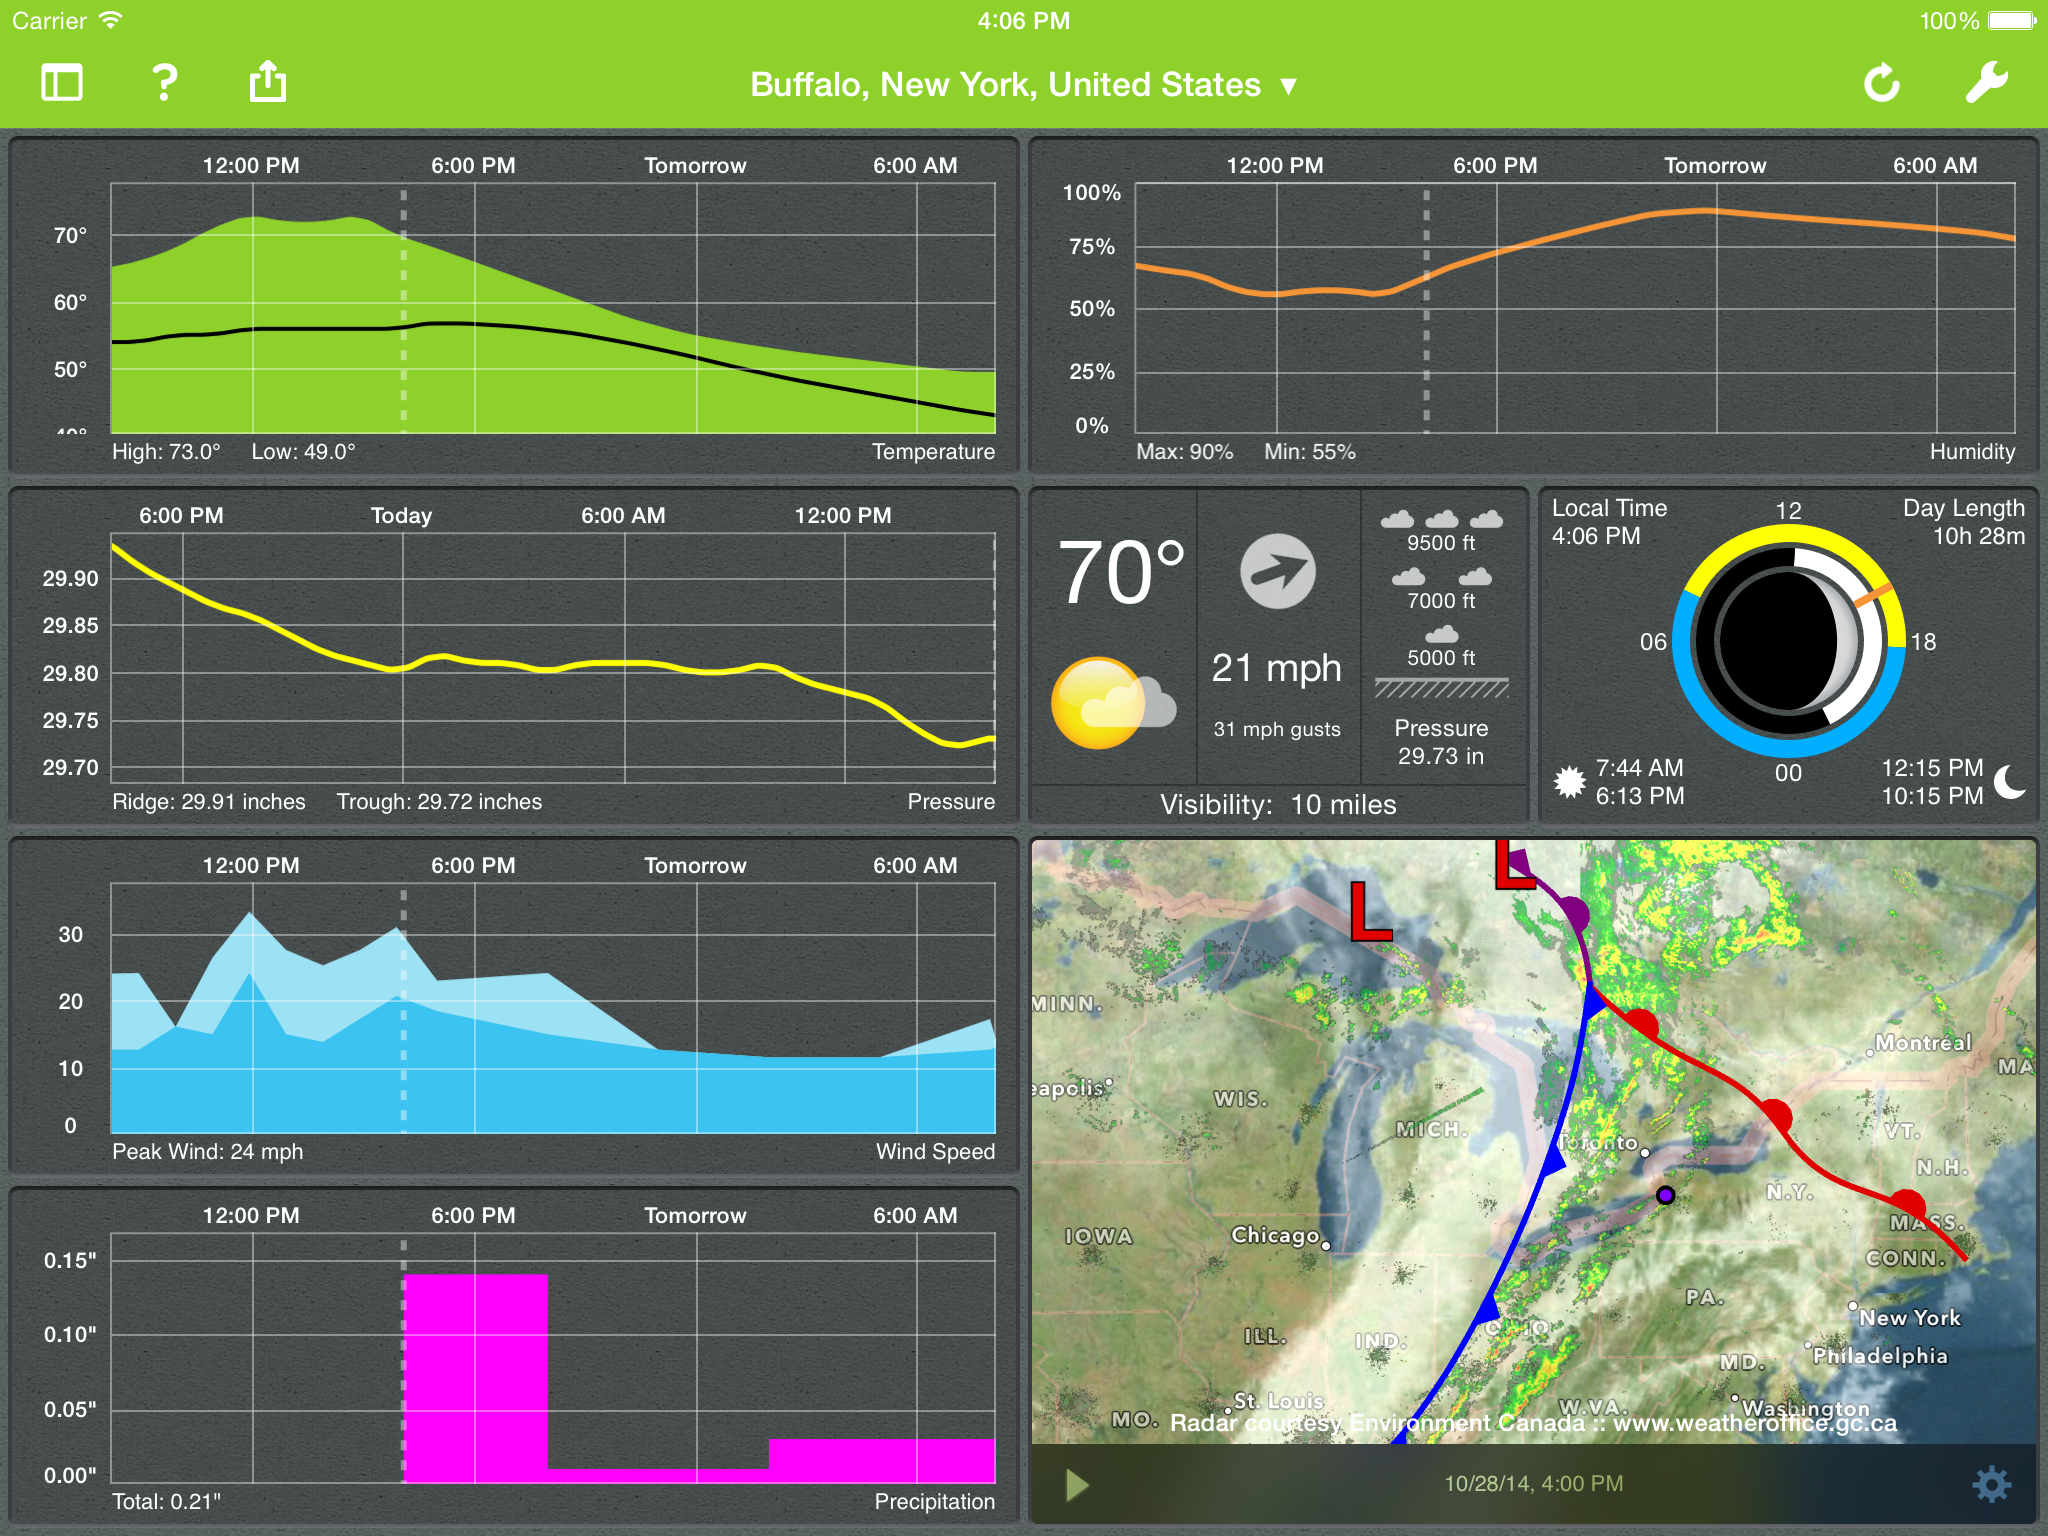
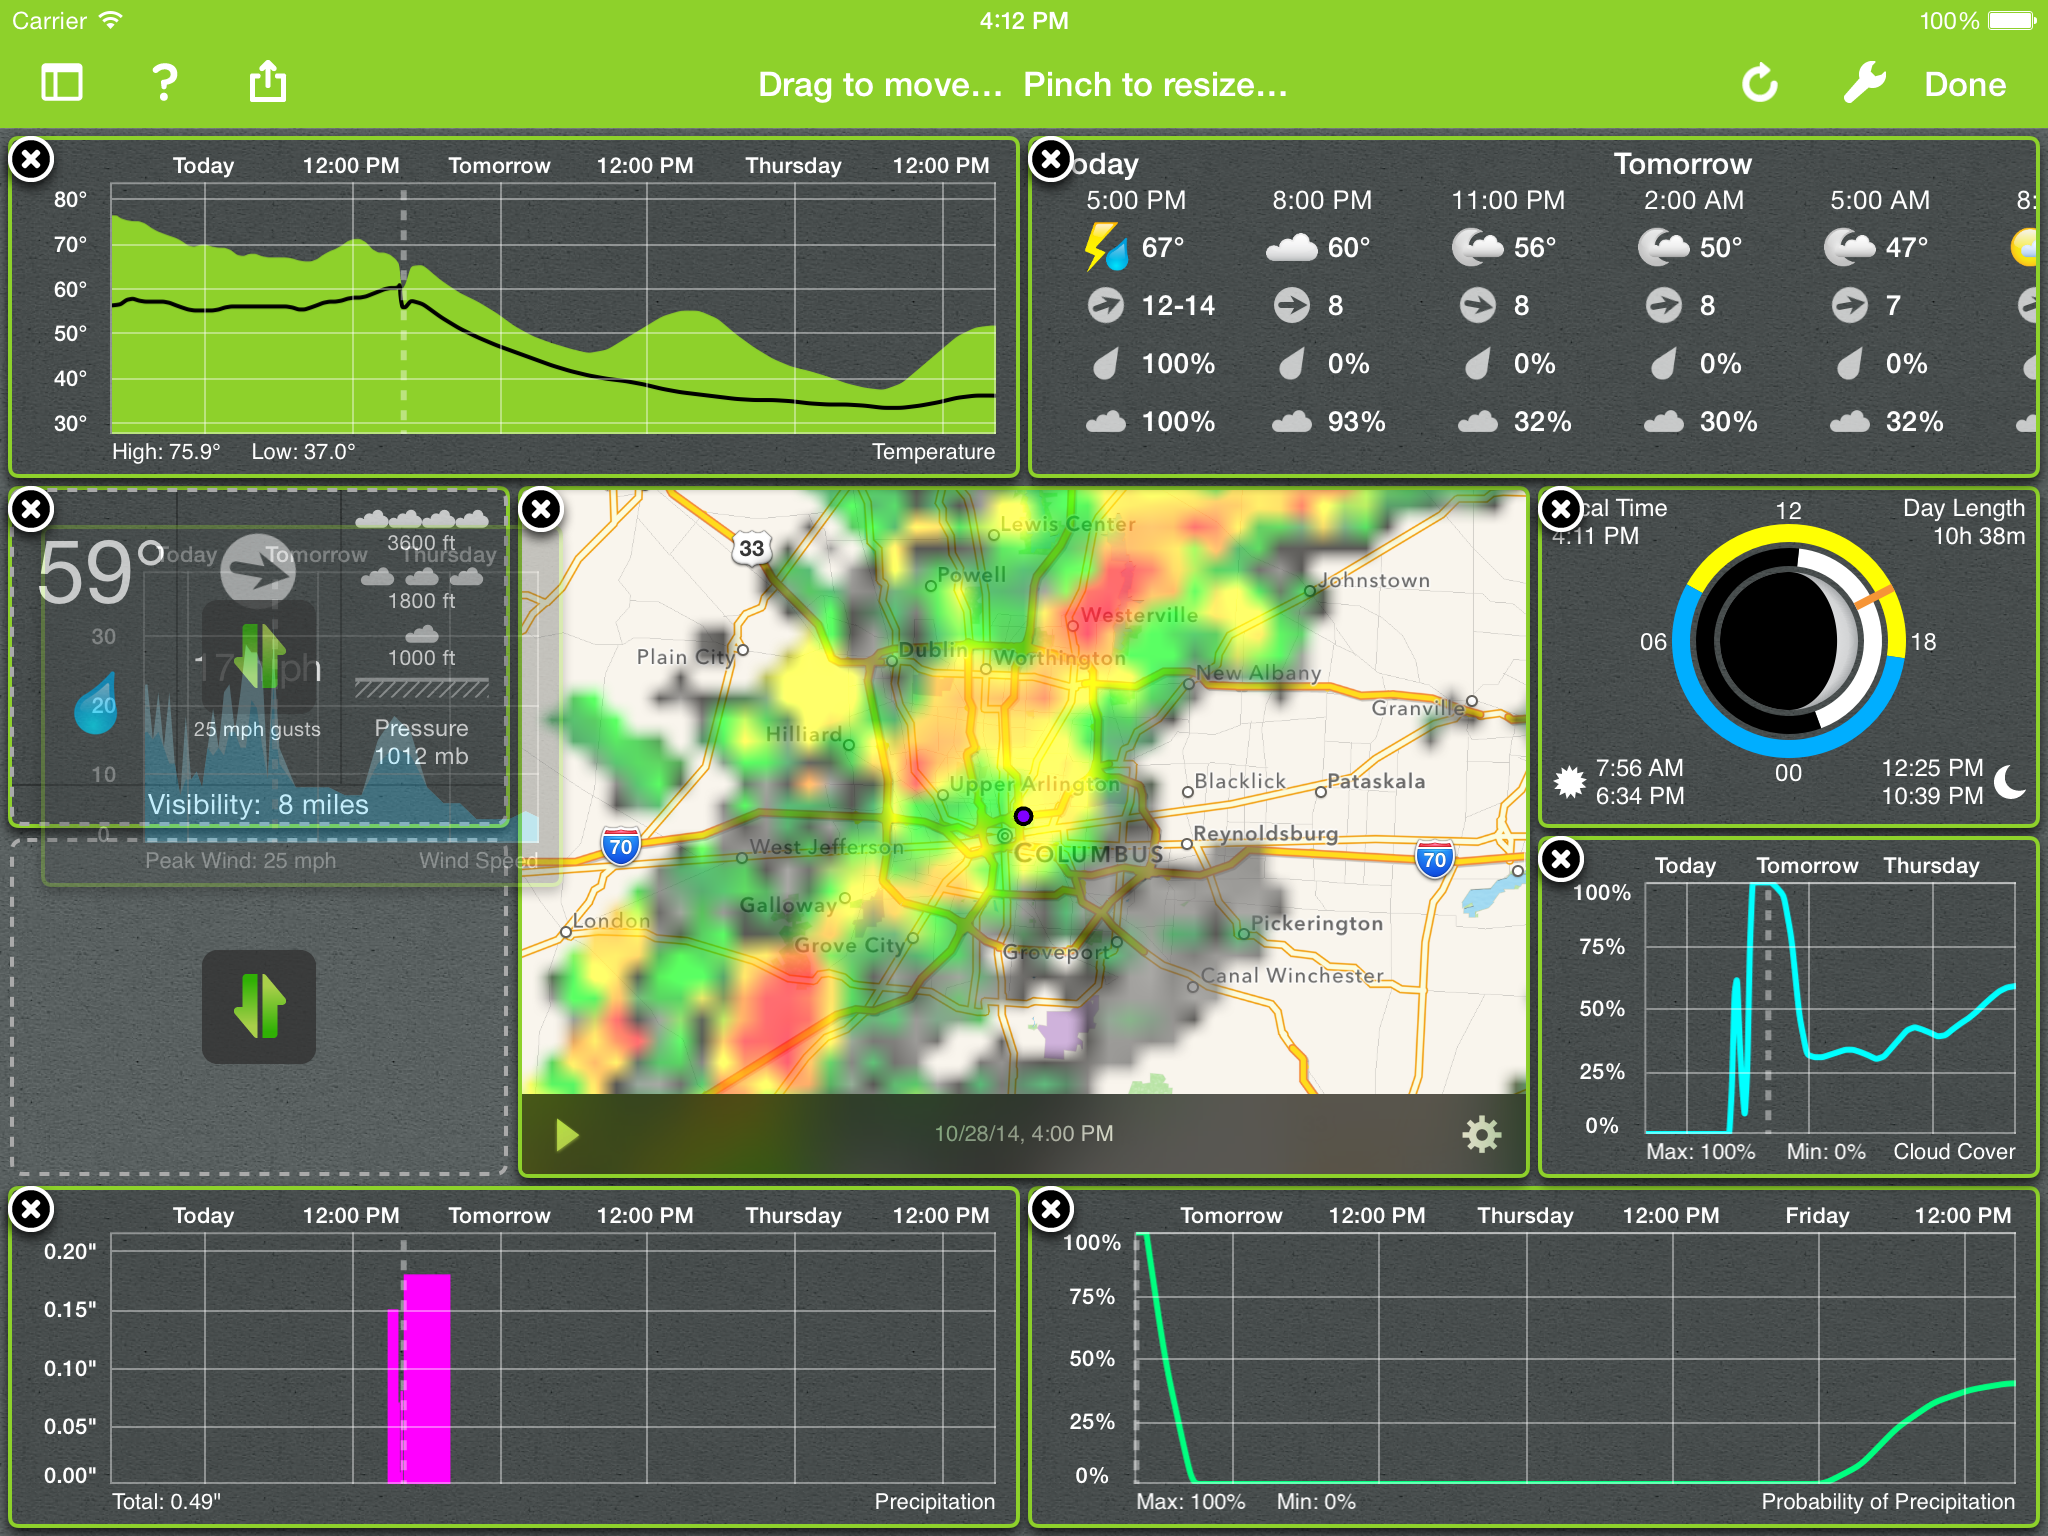
Data is presented as meaningful graphs, whose design and color palette have been optimized for legibility, even in challenging conditions.
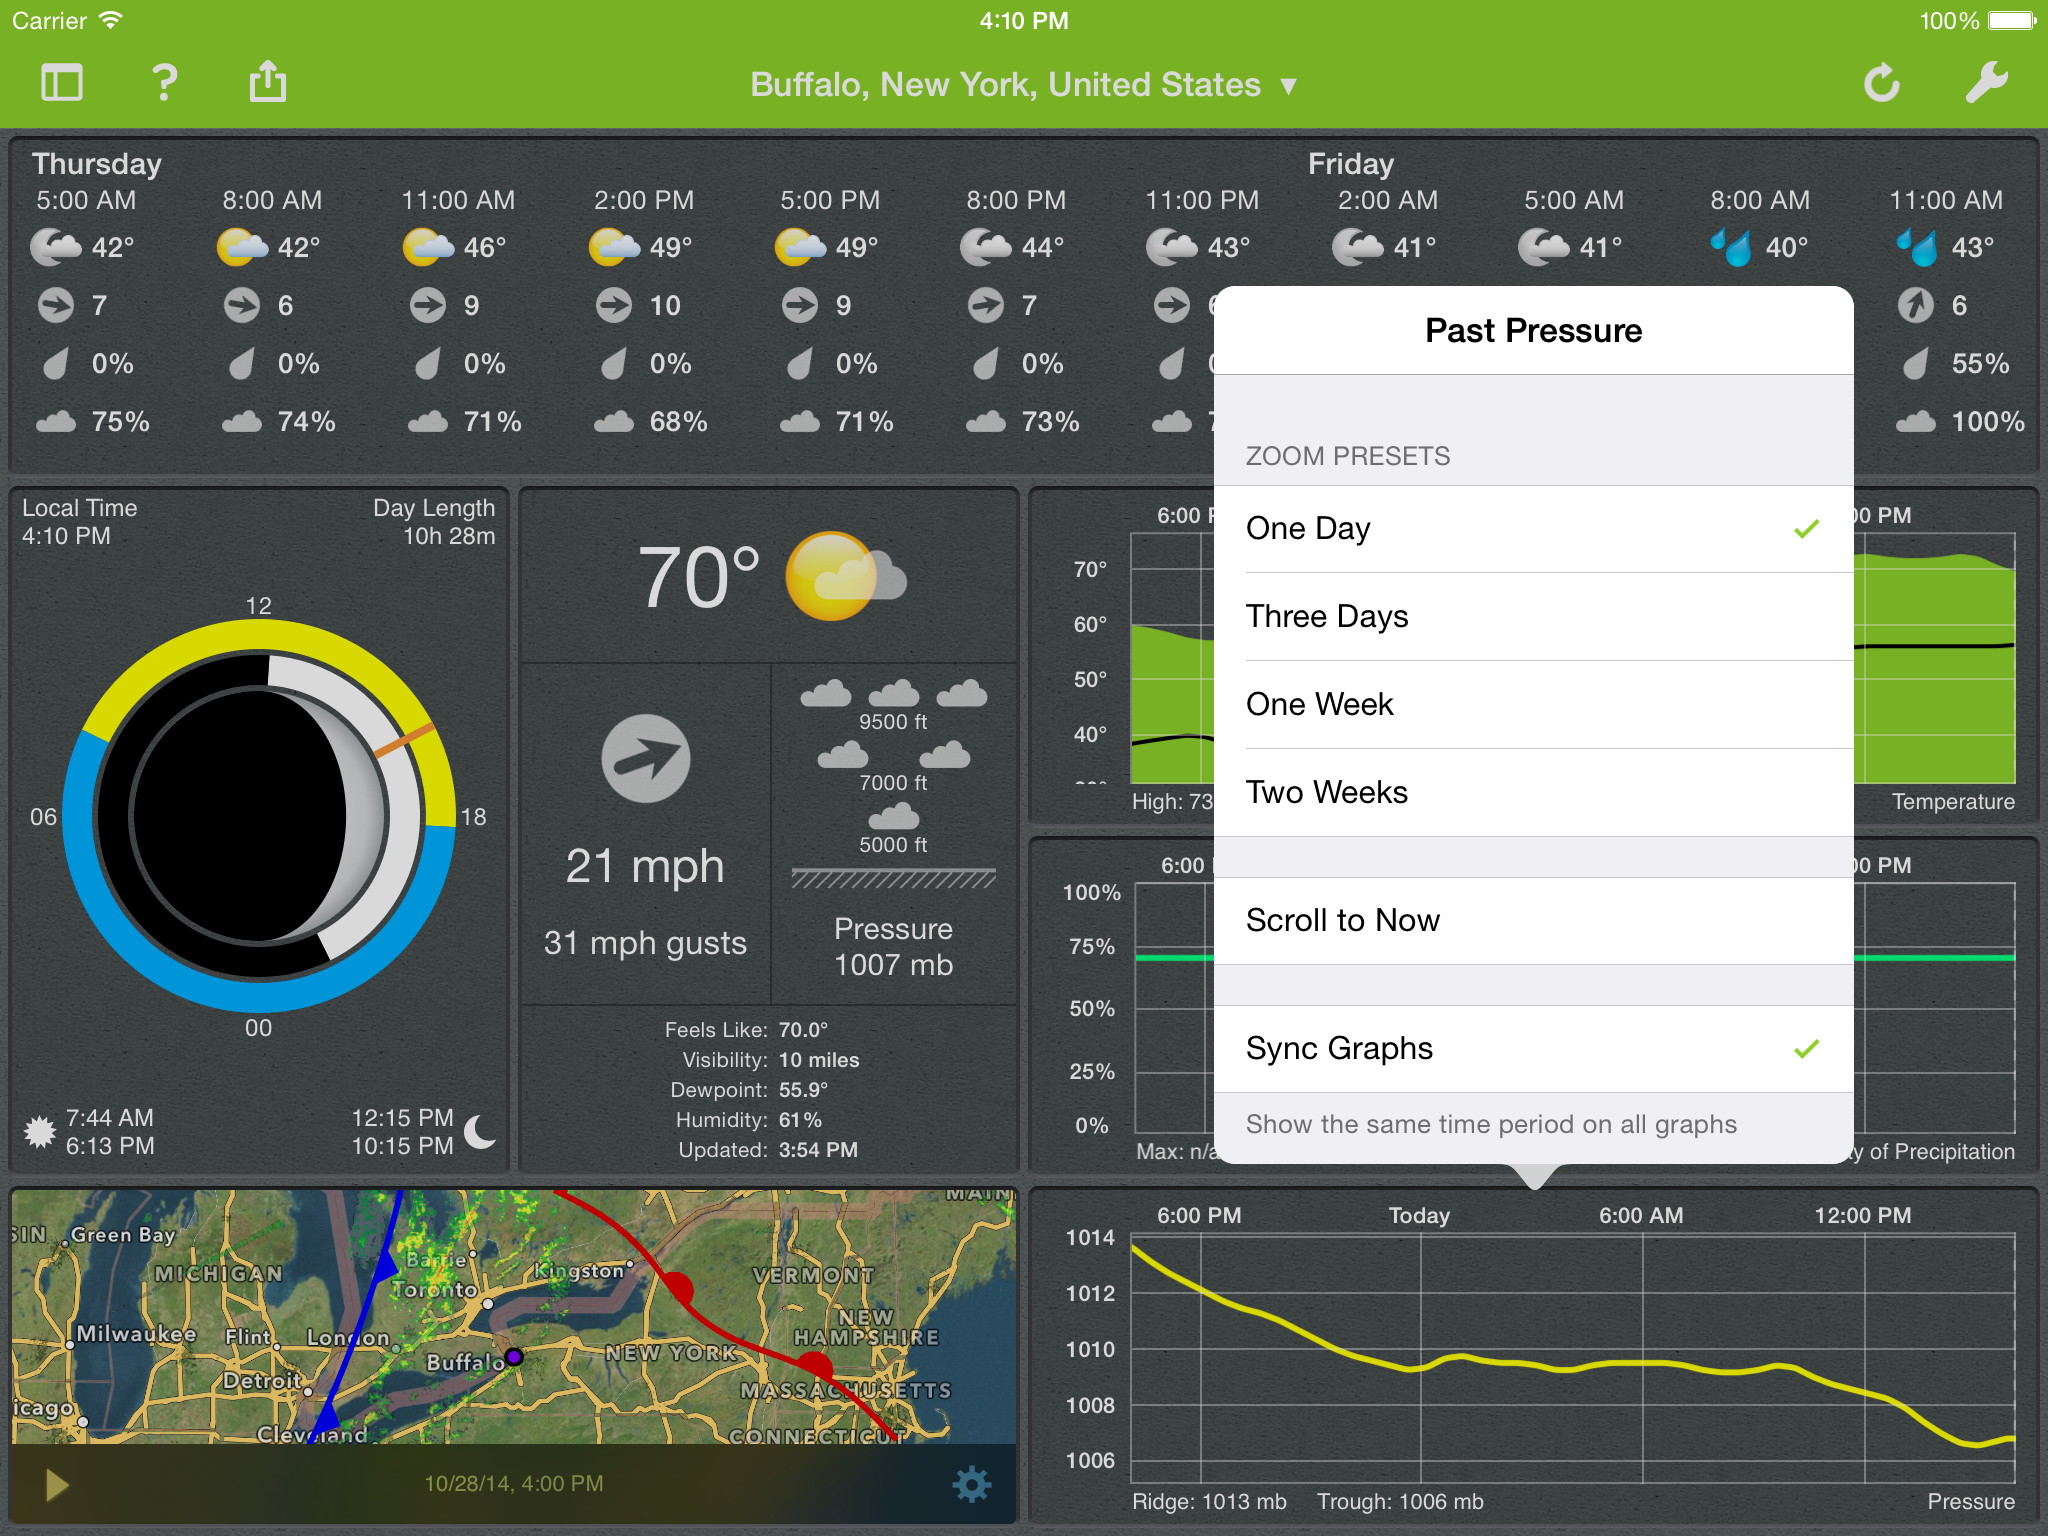
Seasonality Go can download up to four days worth of past data, and saves up to two weeks of continuous data on your device. This makes it easy to work on your weather journal or to perform calculations of your own.
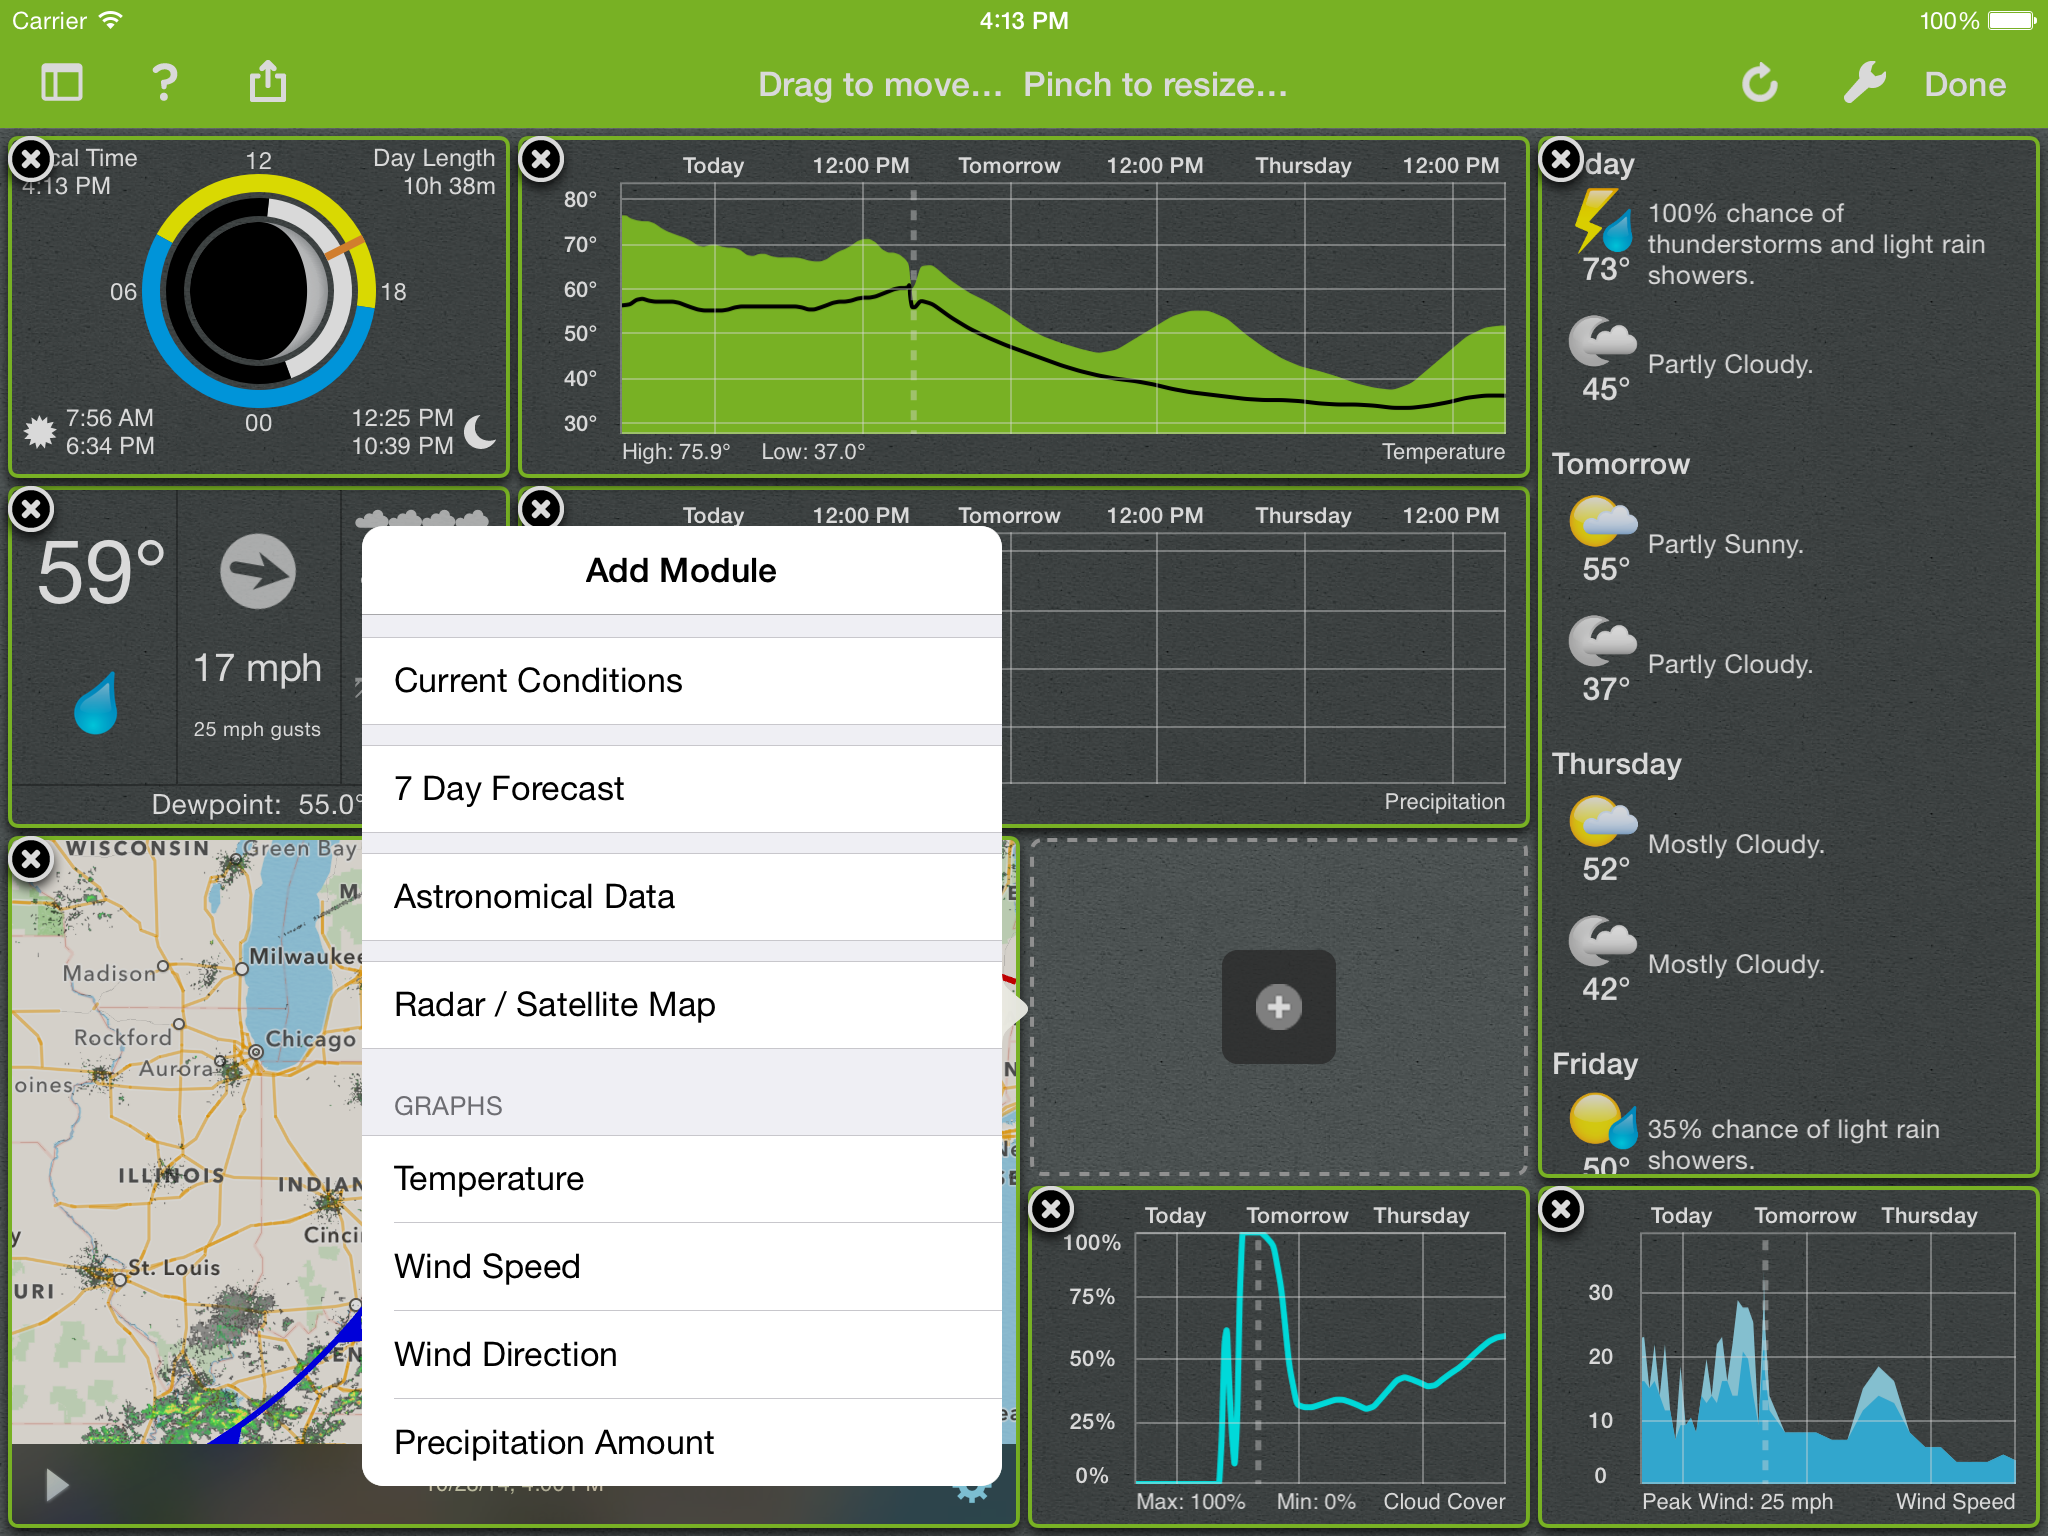
Our exclusive modular interface in the iPad version allows you to create as many dashboards as you wish to track the data you want.
You can create an infinity of screens, each displaying a particular set of data for a location. For example, you can have a screen for your home and another for your beach house. Or you could create a screen for work days and another for your surf outings.
Use intuitive gestures to interact with the data: pinch and zoom to adjust timelines, double tap to reset and access advanced tools, drag to resize modules as you compose and edit your personal screens.
Seasonality Go is usable right from the start, and you can learn expert features as you go. There’s no learning curve, and the application comes with sane defaults for immediate benefits.
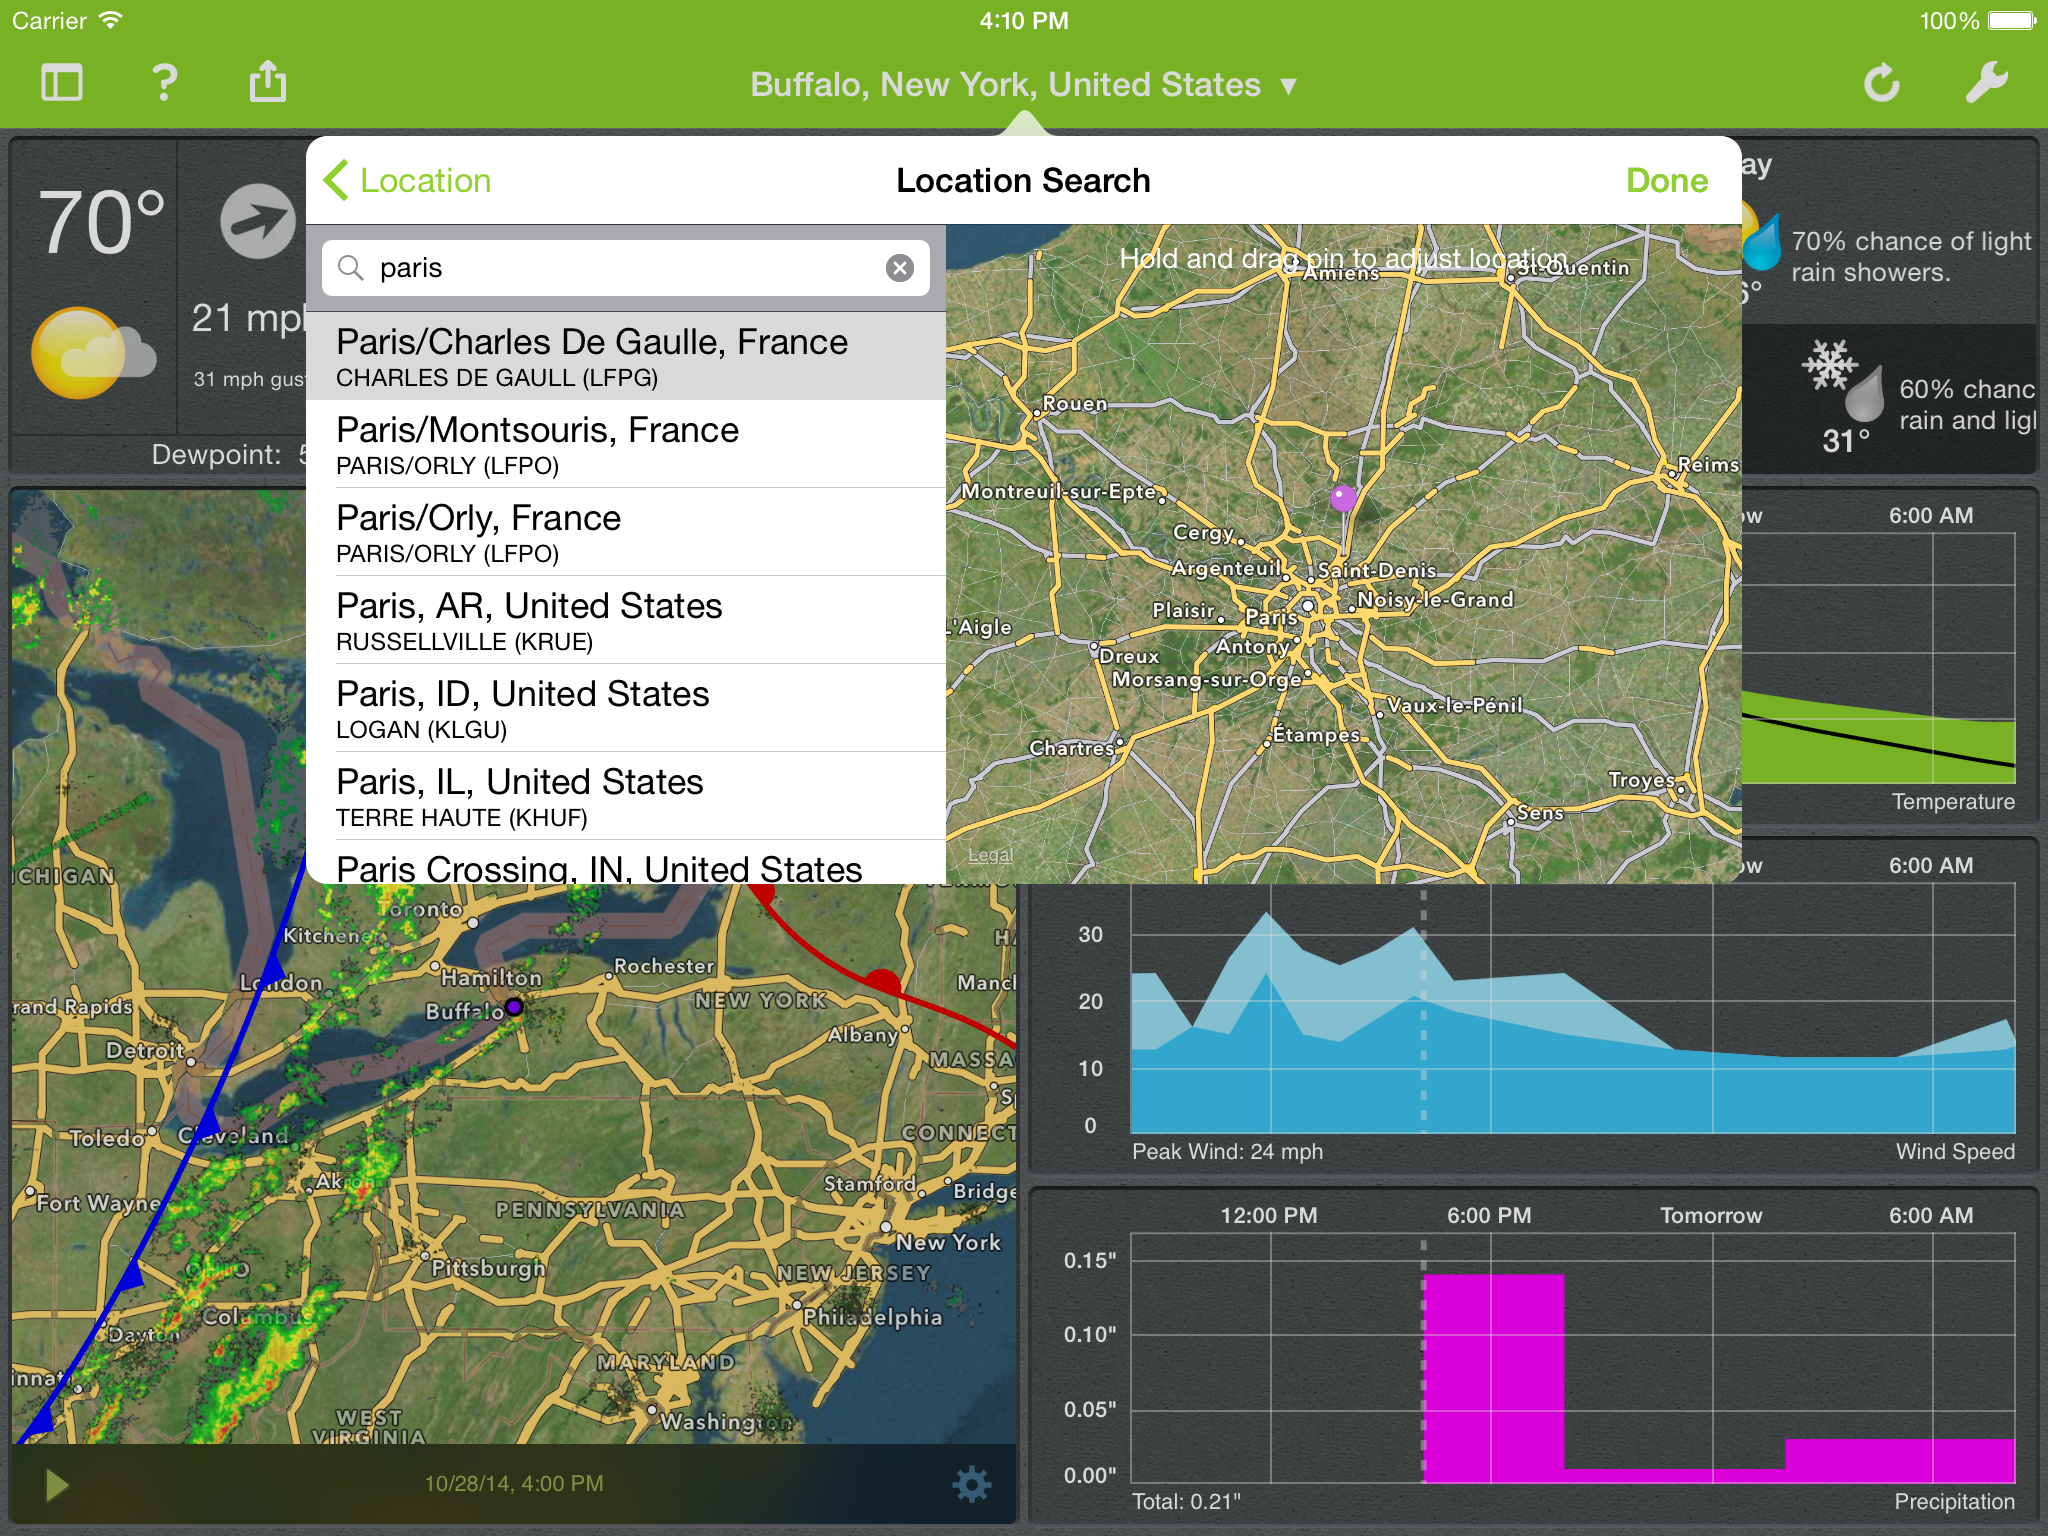
Seasonality Go knows no boundaries. The application comes bundled with over 30,000 locations in over 200 countries worldwide for one-tap access.
If you can’t place yourself on the map, our live tracking feature taps the power of the geolocation capabilities in iOS to locate you and refresh the screen as you move.
Thanks to our custom back-end, which has been extensively tested since 2004, we gather, process and track data from around the world.
Some advanced features may not be available worldwide just yet but we’ve got you covered with the basics wherever you go. We are also working hard on expanding our coverage, for all our users.
While weather data is now available from a wide range of sources, not all tools are equally accurate or reliable.
This is why we continuously poll the best possible sources, including the National Weather Service in the United States and similar scientific institutions around the globe. Our own back-end then compiles and prepares the data for broadcast.
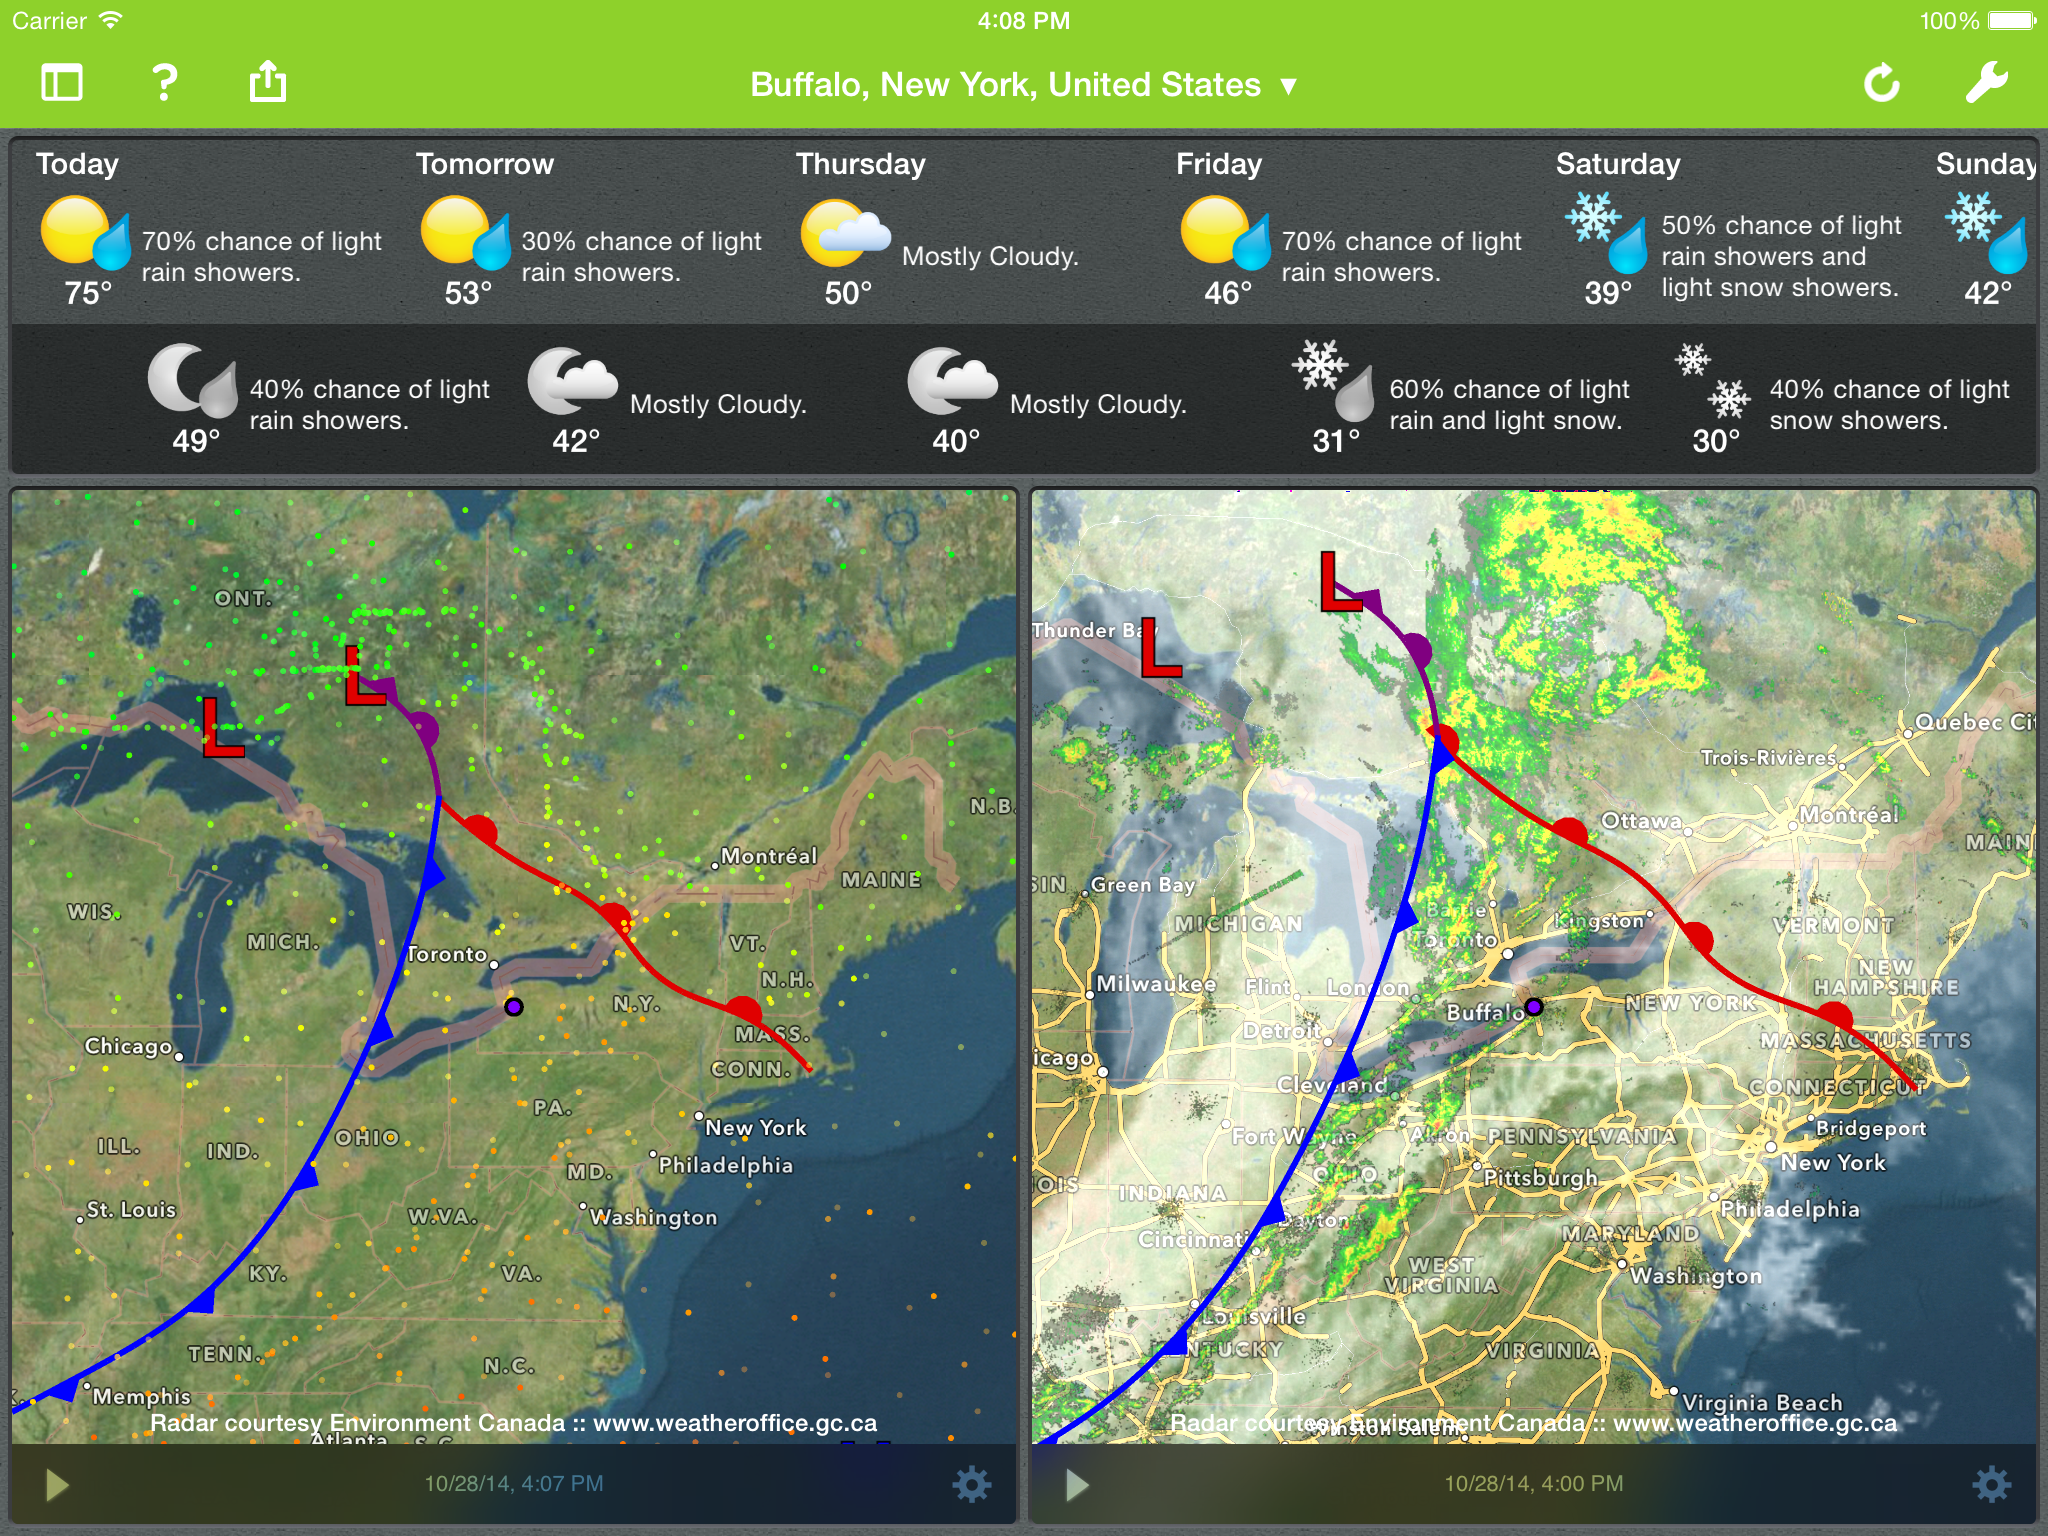
Because Seasonality offers full details, such as maps, graphs and numerical data, you can delve deep into the information from many angles and understand how it may affect your planned activities.
Seasonality Go relies on independent and non-commercial scientific sources for its data which guarantees balanced, complete and continuous reporting.
$9.99 gets you today’s most intuitive and advanced weather application for the iPhone and iPad, as well as access to our famed back-end that downloads and crunches data from all around the world for comprehensive reporting, at no extra cost.
Unlike subsidized alternatives Seasonality Go provides ad-free, subscription free access to your data. That means no nags and no recurring costs.
Our exclusive interface replaces many extra gadgets and services, making Seasonality your one-stop source for weather data in the long run, be it at home or on-the-go.
Because Seasonality’s data comes from state-operated and research operations, there are no risks of our sources going dark or charging for the content on a whim.
Seasonality Go has been discontinued and is no longer available to download.